TrendnTrade Charting software
As an educated investor you need a technical & fundamental analysis tool flexible enough to adapt to our trading style and quickly complete a wide range of tasks.
- TrendnTrade does that and much more!
- Available as End-of-Day version
- Also in TrendnTrade LIVE Real Time!
- How can I get to see it? <-Click here
It is the best technical and fundamental analysis charting software on the stock market. Whether you simply want to look at charts, run daily scans on the market for new stock picks or build a complete automated trading solution.
TrendnTrade is the complete package. With over 100 built-in indicators, tools, back-testing capabilities and a powerful scanning engine, TrendnTrade already has the essential tools any investor needs. The use of the programme is easy enough for a beginner yet fully comprehensive for the advanced investor and trader.
TrendnTrade has a custom programming language allowing you to create your own indicators, scans and stock trading systems with a superb graphic interface.
How can TrendnTrade help you?
- Trade from the Charting platform: Buy and Sell Single Stock Futures & Alsi Futures direct through TrendnTrade
- No waiting on the phone to speak to a broker - deal direct from TrendnTrade
- Scan the market for opportunities in minutes saving you time.
- Automate and fine tune your systems and remove emotions (fear and greed) from your trading.
- Heard about a new strategy or came up with an idea? Simulate it historically without risking your money.
- A comprehensive and fully integrated portfolio manager, for up to date information on your investments
- Charts That Are Clear, Colourful & Alive
- Scan on Chart Patterns: scan for bearish & bullish harami, engulfing and cross ups & downs for example.
- Have the charts of one share / instruments open in multiple time frames ie 1 min, 15 min, 30 min, daily & weekly on one chart page!
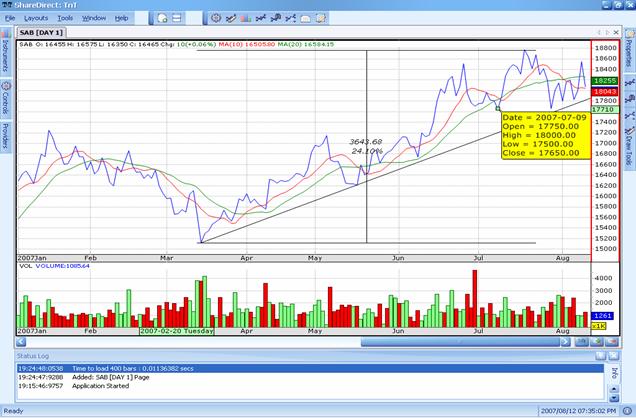
Charts are the most integral and visible component of TrendnTrade. Charting is a visual interpretation of a stock. Indicators can be plotted on a chart enabling you to see past performance, current movements and future expectations.
Line studies can be drawn on a stock chart to show how prices and indicators react at certain price levels or time intervals. Every item onscreen responds to an instant menu when you click on it. When you have finished your analysis, TrendnTrade saves all the details of your work with its Layout feature so that your analysis is right there the next time you re-open a chart.
TrendnTrade gives you four of the most widely-used price charting styles to choose from. You can also change many aspects of the price plot’s appearance, including style, colour and line thickness.
This program gives you a multitude of options to help you see a variety of unique stock market perspectives.
- Templates & Layouts
With the Template option you can apply the same set of indicators and studies to different stocks.
Once a chart is saved as a template you can quickly rotate through the stocks while keeping the same indicators and line studies on the screen, saving you hours of work. You can also create a default template that is always used when a new chart is opened. Once you create your template you can use it over and over again.
TrendnTrade Layouts are a convenient way to manage groups of charts. You can combine your favourite stocks into one easily managed group. You can save all your on-screen charts together like pages in a book.
So whenever you open your layout, the same securities are there every time!
- Built-in Indicators & Line Studies/ Indicator Library
An indicator is used to predict future financial or economic trends. In technical analysis terms, an indicator is a mathematical calculation that is applied to a stock’s price.The result is a value that can be used to anticipate changes in market movement. TrendnTrade has a great collection of indicators. The software comes fully loaded with all the most popular indicators, and many of less known ones.
Every Indicator has a full description on what it does, how to apply it and the flexibility for the user to change it according to their investment or trading strategy. The indicators are also grouped according to their specific use for easy reference and application.
Looking for a new indicator that is not in TrendnTrade? No need to worry, one of the advantages of using distinguished software such as TrendnTrade is the ability to import or even write your own indicators!
TrendnTrade also offers over 70 lines studies with its charting package. Line studies are a technical analysis tool that consists of lines drawn on top of a stock’s price and/or indicator. Line studies are placed using menu bars that can float freely or can be docked on the side of your screen. The line studies available in TrendnTrade include Trend lines, Fibonacci lines, Regression channels, Cycles and many more.
- Technical Indicators
- 7 Different Band Indicators
- 12 Different Extended Indicators
- 8 Index Indicators
- 17 Momentum Indicators
- 6 Native Indicators
- 9 Oscillator Indicators
- 12 Others
- 5 Price Volume Indicators
- 14 Trend Indicators
- 5 Volatility Indicators
- 5 Volume Indicators
- 10 Years Data
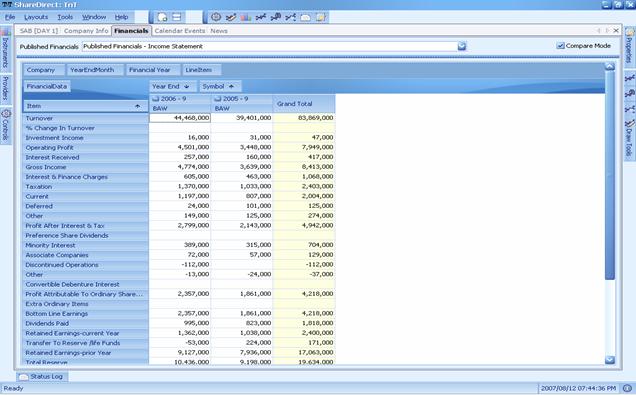
- Fundamental Analysis
AND
- 10 Years Fundamental Data
- PE Ratio, Earnings Yield, Dividend Yield, etc
- Calendar of Stock Market Events
- New Listings
- Detailed Financial Reports
- Brokers Consensus
- LIVE SENS Announcements
- Other News Items
- Directors Dealings
- Multiple Fundamental Screens
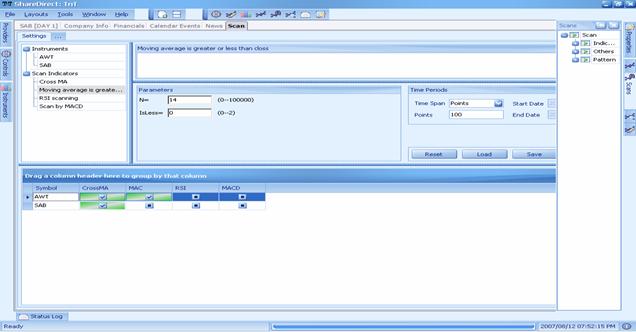
- Scan Facility
- Scan on Technical indicators
- Scan on Chart patterns
- Scan on Others
The scan facility quickly searches for opportunities using technical parameters, for easy analysis and comparisons. You have the option to scan the entire market or only the sectors of interest to you, thus saving you time.
- Systems Requirements for End-of-Day
Minimum Recommended Specifications
Operating System |
Windows XP - Service Pack 2 |
CPU |
Intel Pentium - 4 -1.4 GHz |
Memory |
512M |
Hard Drive (space) |
100MB |
Recommended Specifications
Operating System |
Windows XP – Service Pack 2 |
CPU |
Intel Celeron - 2.8 GHz |
Memory |
1Gig |
Hard Drive (space) |
200MB |
Please note : We will not be supporting Windows 95, 98 or Windows ME. The system will work with most video cards but, the chart refresh rate is improved by a good video card. Hard drive space is estimated and will grow over time to accommodate retrieved data storage.
Updates and upgrades are included in the downloads costs per month.
Do you want a TrendnTrade demonstration? Or come to a presentation!
